India’s August jobs report: what 5% unemployment leaves out
Who is working, who is looking, and who is outside the labour force? Three measures explain the difference.
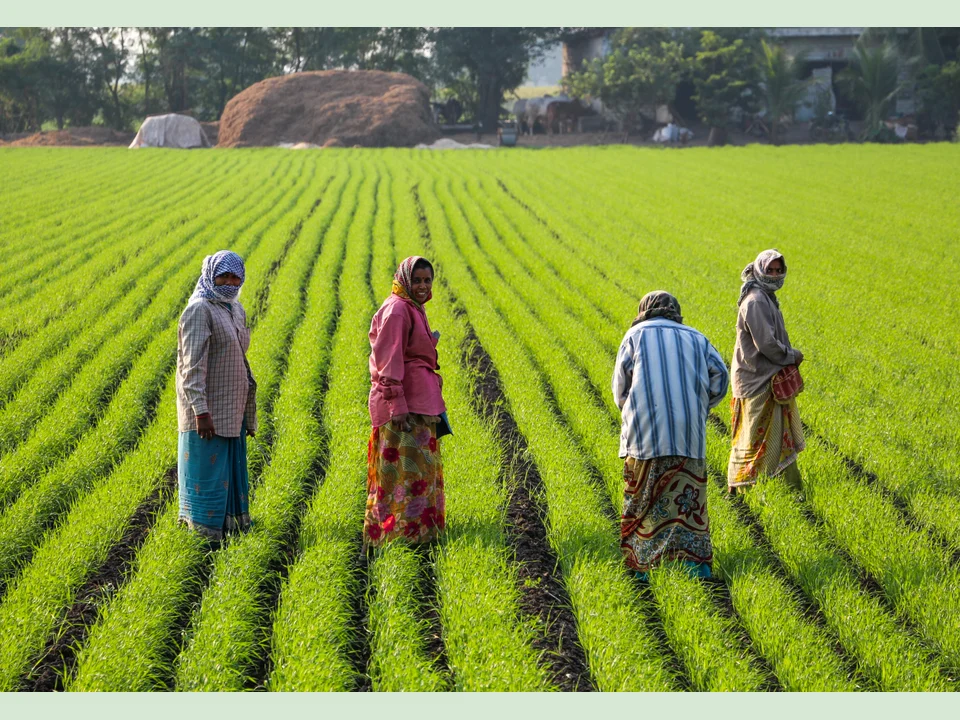

India's unemployment rate was 5.0% in August 2026, according to the jobs report released on 15 September. In the same report, 52.8% of people aged 15 and above were working. Those numbers can both be true: they count people against different totals.
The Periodic Labour Force Survey's August bulletin offers a useful way to look beyond the unemployment headline. It asks three connected questions: who is participating in the labour market, who has work, and who is available for work but has none?
Reading the measures together helps distinguish a rise in employment from a fall in the number of people looking for work. Earnings and hours add another question: whether the work available is enough to support a household.
Start with the people in the count
The labour force includes employed people and unemployed people who meet the survey's work-seeking or availability condition. It does not include everybody above a particular age. Someone studying full-time and neither working nor available for work, for example, sits outside it.
The labour force participation rate, or LFPR, measures this group as a share of the population. For the August figures here, the population means people aged 15 and above. The worker population ratio, or WPR, measures employed people against that same population. The unemployment rate uses a smaller denominator: the labour force.
Suppose a neighbourhood has 100 people in that age group. Fifty have work, five have none but are available for it, and 45 are outside the labour force. Participation is 55%, employment is 50%, and unemployment is five divided by 55, or about 9.1%. It is not five divided by 100.
Illustrative example · 100 people aged 15+
Labour force: 50 + 5 = 55 people
Unemployment rate: 5 ÷ 55 × 100 = 9.1%
Now return to August. Participation was 55.6% and employment was 52.8%. Their difference, about 2.8 people per 100, represents unemployment as a share of the population. Divide that difference by the 55.6 participating and you get approximately 5%. The published rates are rounded, so this reconstruction is approximate.
What counts as having work?
The monthly survey uses Current Weekly Status: activity during the seven days before the interview. The bulletin explains that someone who worked for at least one hour on any day in that week counts as a worker. Someone who did no such work but sought or was available for it for at least an hour on a day in the week can count as unemployed.
This makes the unemployment rate useful for a specific question: how much of the available labour force had no work in that short period? It cannot tell a household whether its income covers the rent. A person who gets a few hours of work and wants much more can still count as employed.
Nor does an employment count mean a count of permanent salaried jobs. The survey's framework covers different kinds of economic work. Evaluating living standards also requires information about earnings, hours, the kind of work and its continuity. The NSO's explanation of the redesigned survey distinguishes the monthly indicators from the broader employment-status and industry detail in quarterly results.
August's improvement was stronger in rural India
The national unemployment estimate moved from 5.1% in July to 5.0% in August. Underneath it, rural unemployment fell from 4.5% to 4.1%, while the urban estimate edged from 6.7% to 6.8%.
The employment share helps interpret that difference. Rural WPR rose from 55.4% to 55.8%; urban WPR remained at 47.0%. Rural participation also rose, from 58.0% to 58.2%, while urban participation stayed at 50.4%. These are the bulletin's estimates for people aged 15 and above.
Workers per 100 people aged 15+ · Current Weekly Status
Bars use a common 0–100% scale. Source: NSO, August 2026 PLFS bulletin, Statement 2, page 7.
That combination is more informative than falling unemployment alone. If people leave the labour force, unemployment can fall even without additional employment. August's rural estimates instead show a higher share participating and a higher share working. The bulletin does not establish which policy or industry caused the change. As survey estimates, small monthly movements also carry sampling uncertainty.
Women's participation raises a second question
The overall female participation rate rose from 34.4% to 34.8%. But the rural and urban levels remained far apart: 39.4% and 25.4%, respectively, in August. The 15 September release reports the increase alongside the other indicators.
Participation tells us whether someone is inside the measured labour market; it does not explain every reason someone is outside it. A policy discussion therefore needs to ask what prevents people who want work from taking it up, as well as whether employers are hiring. Transport, care arrangements and working hours are examples of conditions to investigate, rather than conclusions established by these monthly totals.
Young jobseekers face a different picture
Among people aged 15–29 who were in the labour force, the unemployment rate was 15.1% in August. That is considerably higher than the 5.0% rate for the labour force aged 15 and above. Both rates exclude people outside the labour force, including students who were not working and did not meet the survey’s work-seeking or availability condition. The national average therefore leaves out an important difference in the experience of younger jobseekers.
What to look for in the next jobs headline
Begin with the age group and reference period. Then read participation, employment and unemployment together. Ask whether an apparent improvement is broad across rural and urban areas and whether later evidence shows more hours, better earnings or more secure work.
Keep comparisons consistent. NSO redesigned the survey from January 2025 and cautions readers about comparisons with the earlier design. A monthly seven-day measure also answers a different question from the annual usual-status measure, which looks over the preceding year.
August's report gives a clearer picture when all three indicators stay in view: a modest national improvement, stronger rural employment participation, and an urban employment share that was unchanged from July. For households, the next question is what work those figures represent and what it pays.