September inflation rose to 5.54% as food prices climbed faster
Food inflation reached 7.74%. The latest CPI release shows why annual rates and the change since August need separate readings.

India’s retail inflation rose to 5.54% in September 2026, while food inflation reached 7.74%, according to the National Statistics Office’s October 12 release. Both were higher than August’s final readings: 4.83% for the overall consumer price index and 5.97% for food. September’s figures are provisional.
These headline rates compare prices with September last year. Prices also rose between August and September this year, but by smaller percentages. Keeping those two comparisons separate helps explain what the latest release says about the cost of groceries and other purchases.
Food prices rose faster than the wider basket
The consumer price index, or CPI, tracks a weighted basket of goods and services. Food is part of that wider basket, alongside purchases such as transport, healthcare and housing. The Consumer Food Price Index, or CFPI, measures the food basket separately. Its 7.74% annual increase can therefore sit above the overall CPI’s 5.54%.
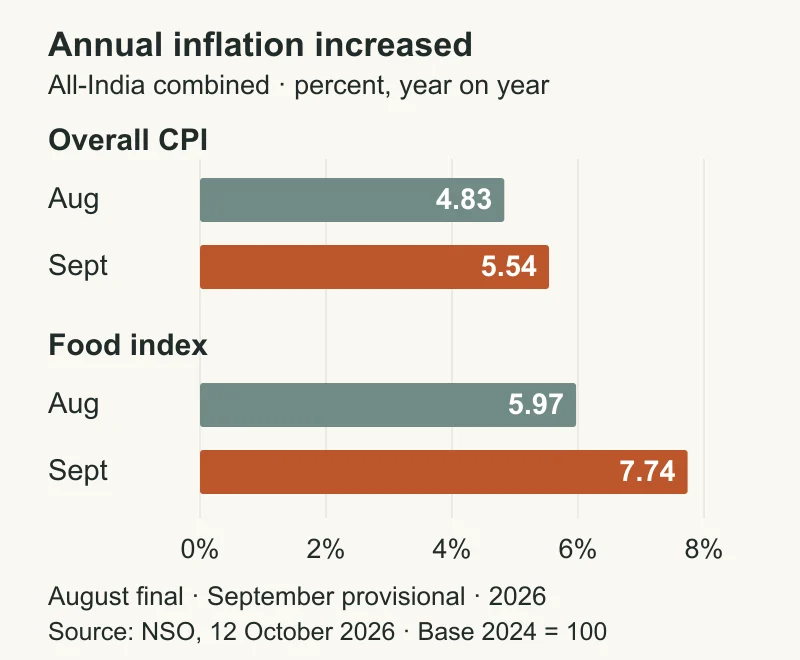
All-India combined annual inflation, August and September 2026. August is final; September is provisional. Source: NSO’s October 12 release.
The overall annual rate increased by 0.71 percentage points from August; the food rate increased by 1.77 percentage points. Percentage points describe the difference between two rates. They do not tell us how many rupees were added to a shopping bill.
The national averages also combine different places. September’s annual headline inflation was 6.08% in rural areas and 4.88% in urban areas; the corresponding food rates were 8.06% and 7.18%. A national reading describes the measured basket across the country, while a person’s own purchases and local prices can differ. Our August inflation explainer explains how spending patterns affect that experience.
What changed between August and September?
An index records the price level of a basket relative to a reference period. This CPI series uses 2024 = 100: the average price level in that base year is represented by 100. The base year provides the scale; it is separate from the period used to calculate an inflation rate.
For an annual rate, September’s index is compared with September 2025. For a month-to-month change, it is compared with August 2026. The release supplies the index levels needed for both comparisons.
| All-India combined index | August 2026, final | September 2026, provisional | Approximate monthly increase |
|---|---|---|---|
| Overall CPI | 108.74 | 109.49 | 0.69% |
| Food index | 110.73 | 112.17 | 1.30% |
Monthly increases calculated as (September index ÷ August index − 1) × 100, using NSO’s rounded published indices. These are approximate, unadjusted for seasonal patterns.
The overall basket’s measured price level was about 0.69% higher than in August, and the food basket’s was about 1.30% higher. The 5.54% and 7.74% figures answer a different question: how much higher were prices than a year earlier?
A slower inflation rate would mean that prices were rising less quickly against the chosen comparison period. A fall in the price level would require the index itself to decline. September’s release shows increases in both the annual rates and the latest monthly index levels.
An onion spike can coexist with cheaper tomatoes
Food inflation is an average across many items whose prices move differently. In September’s national item indices, onion prices were 108.09% higher than a year earlier. Tomatoes were 8.62% lower, and potatoes were 11.50% lower. These annual comparisons describe the respective measured items, rather than a quoted price at every shop.
The tomato comparison also changed sharply: its annual rate moved from −31.09% in August to −8.62% in September. That means tomatoes were less far below their year-earlier price level. The annual rates alone do not show the percentage change between August and September.
Each item’s influence on the overall index depends on its weight as well as its price movement. A large onion increase does not imply that all food doubled in price, or establish exactly how much onions contributed to the headline rise. The release reports the item changes, but does not provide a causal breakdown assigning September’s increase to weather, oil prices or any other single factor.
What to check in the next release
The next monthly release will finalise September’s provisional figures. When reading the new rates, check which periods are being compared and whether the figures are final or provisional. Then look at the index level: a lower inflation rate can still mean prices have risen, while a lower index means the measured basket has become cheaper.