September WPI rises to 11.39%: reading India’s goods-price pressure
Wholesale inflation tracks goods near the factory, mine and mandi. Its basket explains why production prices and household inflation can diverge.

India’s wholesale price inflation rose to 11.39% in September 2026, from 9.92% in August, according to the official release published on October 14. Fuel and power prices rose fastest among the three major groups, while manufactured goods—which carry nearly two-thirds of the index’s weight—also recorded stronger annual inflation.
These figures describe prices of goods near the beginning of their journey through the economy: agricultural produce at mandis, minerals at mines and manufactured products at factories. They help explain the pressures facing businesses before a finished product reaches a customer.
What the wholesale index actually prices
The Wholesale Price Index, or WPI, combines price changes across a basket of goods. Its current series uses 2022–23 as the base year. The basket and weights reflect goods production, rather than how households divide their spending.
Despite the name, this is not a survey of everything sold by wholesale traders. The Office of the Economic Adviser’s current FAQ describes prices collected at the factory, mine or mandi stage. WPI uses basic prices: taxes and trade and transport margins are excluded, while applicable subsidies are included. The measure therefore differs from the final price paid by a shopper after goods move through distribution and retail.
The basket also includes intermediate goods such as basic metals and chemicals. A steel coil can matter substantially to manufacturers even though few households buy one directly. This makes WPI useful for understanding production prices, as well as for adjusting business contracts and removing price effects from some measures of economic output.
Where September’s pressure appears
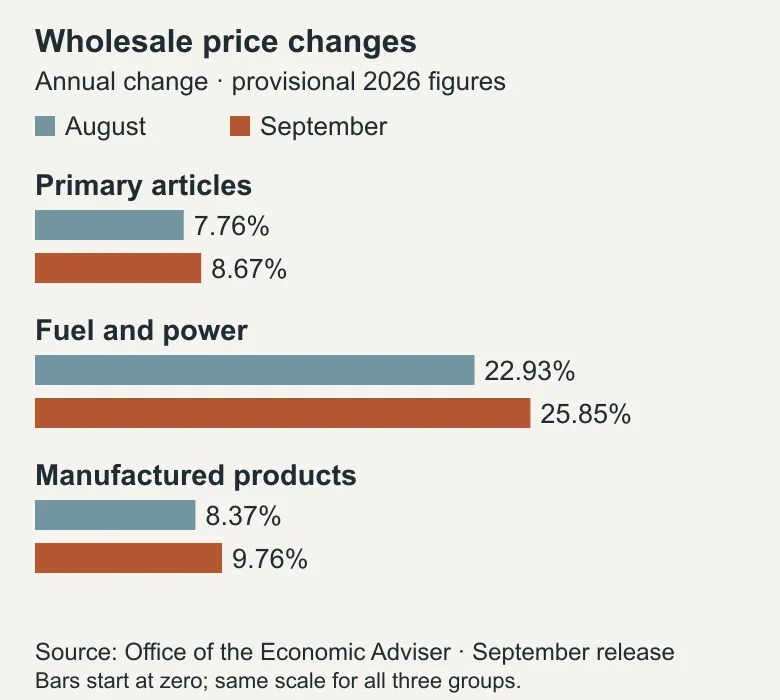
All three major WPI groups had higher annual inflation in September than in August. The comparison below uses each group’s change from the same month a year earlier; both months’ figures are provisional.
| WPI group | August annual change | September annual change |
|---|---|---|
| Primary articles | 7.76% | 8.67% |
| Fuel and power | 22.93% | 25.85% |
| Manufactured products | 8.37% | 9.76% |
Source: September WPI release, Annexure II. Annual changes; August and September 2026 provisional.
Energy-related prices moved differently. September’s annual change was 40.02% for mineral oils, which include petroleum products, and 57.32% for crude petroleum and natural gas. Electricity’s index was 0.43% lower than a year earlier.
Manufactured products had slower inflation than fuel and power, but much greater weight: 63.13%, compared with fuel and power’s 14.11%. Primary articles account for the remaining 22.76%, with these shares rounded. A group’s inflation rate and its contribution to the overall index answer different questions. Reading only the fastest rate can miss price changes across a much larger part of the basket.
Within manufacturing, the basic-metals index rose 16.96% over the year and chemicals rose 16.74%. These figures give businesses a more specific starting point than the headline average. The relevant price pressure depends on the materials a firm buys and the products it sells.
Why retail inflation can look different
September’s consumer price inflation was 5.54%. The Consumer Price Index, or CPI, follows prices paid by households at retail. It includes services such as housing, education and medical care, which are outside the WPI goods basket. Its weights follow household expenditure, so even goods common to both indices can have different importance.
There is also a sequence between production and consumption. A higher materials price can raise a manufacturer’s costs. Existing supply contracts, stocks bought earlier and competition can affect when the manufacturer changes its selling price. Transporters, distributors and retailers then face their own costs and pricing decisions. Some pressure may be passed on, some absorbed through margins, and some offset by other costs falling.
The September WPI reading identifies goods-price pressure along that chain. Household price changes depend on which goods and services people buy and on the prices that eventually reach them.
Follow input and selling prices separately
The same official release also publishes an Output Producer Price Index and a trial Input Producer Price Index. Output prices describe what producers receive for their products. Input prices describe what they pay for purchased production inputs, including trade and transport margins and non-deductible taxes.
Those two views help distinguish a firm’s purchasing costs from its selling prices. Their index levels use different baskets and weights; a business’s profit margin instead depends on its actual revenue, costs and quantities. To understand pressure on a particular industry, the relevant input and output movements need to be read together.
September’s WPI figures remain provisional as further price responses arrive. The next scheduled release, covering October, is November 16. It will show whether pressure broadens or eases across the goods that businesses buy and sell.