Why does Delhi's air get so bad every winter?
Farm fires get the headlines, but the season turns on cold, still air that traps whatever Delhi and its neighbours emit.

On 17 October 2026, the Commission for Air Quality Management (CAQM), which coordinates air policy for Delhi-NCR and the neighbouring states, said its teams were reviewing how paddy stubble burning is being prevented in Punjab districts. Satellite data from ICAR-IARI's CREAMS bulletin, reported by the Economic Times, counted 174 fire events in Punjab between 15 September and 13 October, against 134 in the same period of 2025, about 30% more. Farm smoke gets the attention each autumn. Why does Delhi's air turn bad every winter, and is stubble the main reason?
What is the short answer?
Delhi, like any large city, puts particles and gases into the air all year. In winter the air stops carrying them away. Cold, still air near the ground holds pollution in a thin layer, and the same weather lets smoke and fumes from across the northern plains settle over the city. Winter smog is therefore a trapping problem on top of an emissions problem: the weather decides how much of the pollution stays, and the sources decide how much there is.
The pollutant that matters most here is PM2.5, particles up to 2.5 micrometres across, fine enough to be breathed deep into the lungs. It is measured in micrograms per cubic metre of air.
How does winter weather trap the pollution?
Pollution released near the ground does not rise forever. It mixes upward until it meets air that will not mix with it, and the height of that limit is the mixing height. Researchers Bhandekar and Wilcox of the University of Reading describe mixing that can reach roughly a kilometre in summer but only a few hundred metres in winter.
The limit drops because of a temperature inversion. Normally air gets cooler with height, so warm air near the ground rises and carries pollution up with it. On clear winter nights the ground loses heat and chills the air touching it. Cold, heavy air then lies beneath warmer air, which does not rise through it. The authors compare the result to a lid on a pot. The same emissions are now shared among a much smaller volume of air, so the concentration of particles is higher.
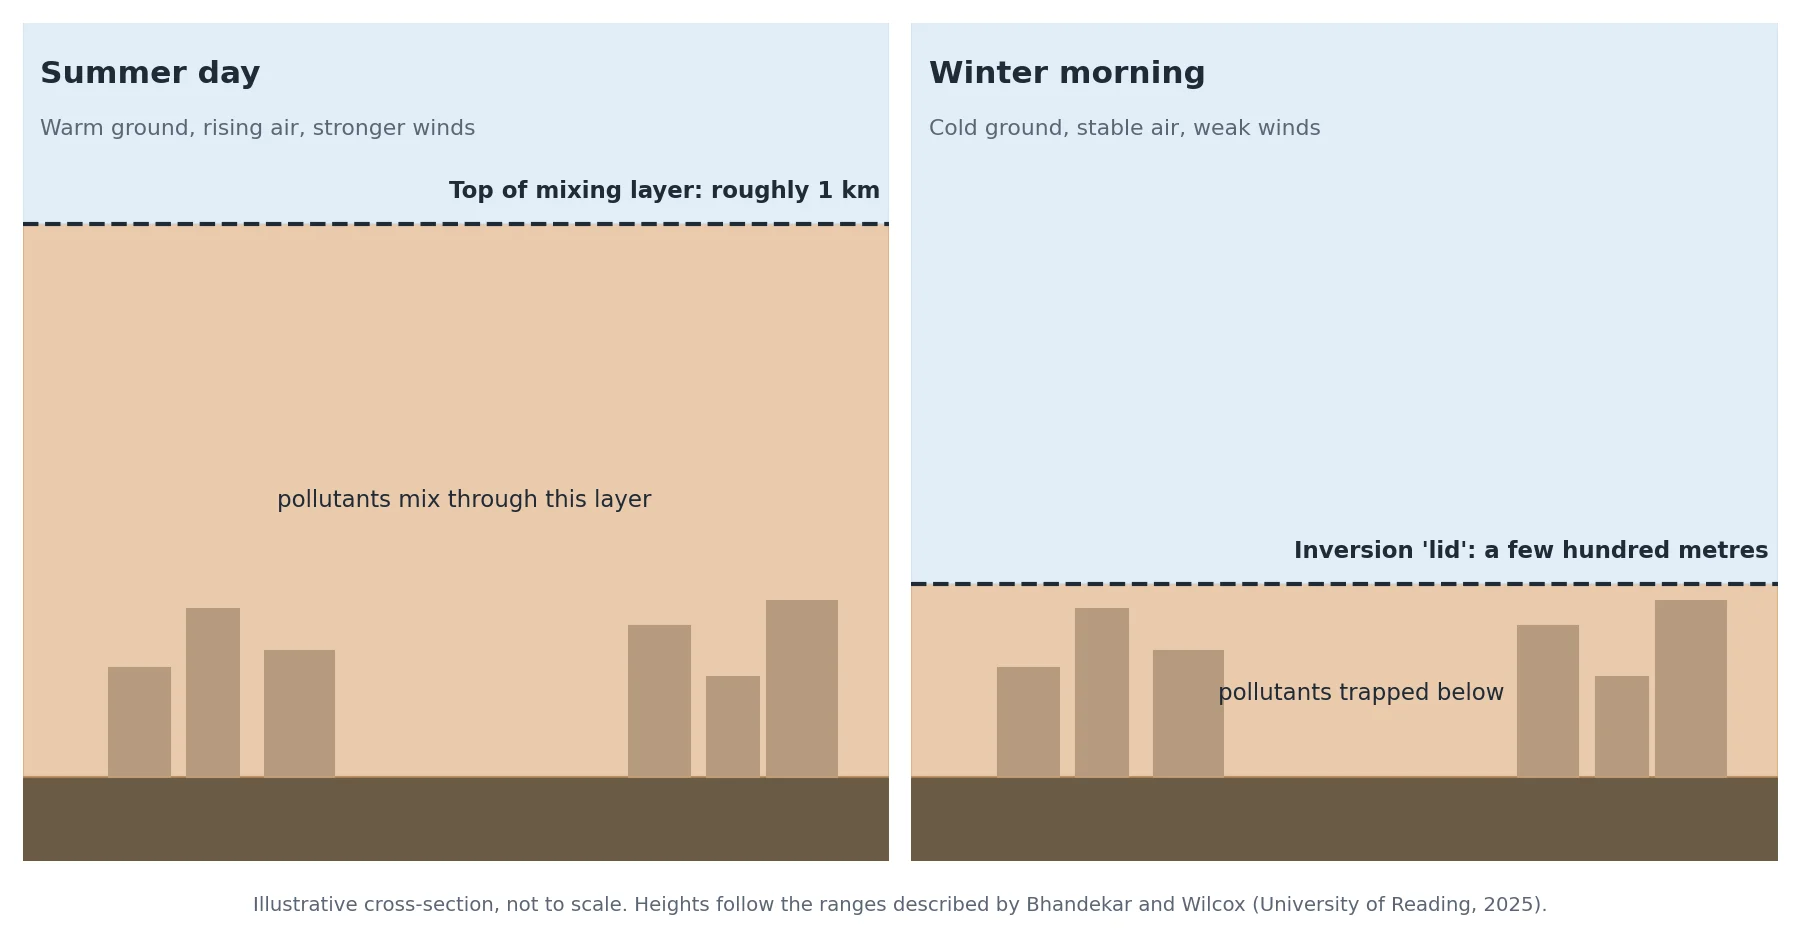
Diagram by BharatQuests. Illustrative, not to scale. Heights follow the ranges described by Bhandekar and Wilcox (University of Reading, 2025).
Wind matters too. Wind speeds fall in October and November, and still air does not push pollution out of the city. A CEEW and UrbanEmissions analysis found 172 hours of calm and light winds (under 5 km/h) between 15 October and 15 November 2020, against 101 hours in the same period of 2019. The monsoon rains that wash particles out of the air have also gone by then.
Weather shifts can change air quality within days. In December 2024, CAQM pointed to a sharp drop in the mixing height and absolute calm. In December 2025 it said a feeble western disturbance cut wind speed, turned winds from westerly to easterly and raised low-level moisture, and that emissions were not the significant reason for that spike.
Why does the geography make it worse?
Delhi sits on the flat Indo-Gangetic plain. The Himalaya rise to the north and the Aravalli hills lie to the south. Bhandekar and Wilcox describe the setting as bowl-like, with the Himalaya blocking the flow of air northward. When winds are weak, there are few exits for polluted air, and the same conditions settle over neighbouring states, so Delhi receives their emissions as well as its own.
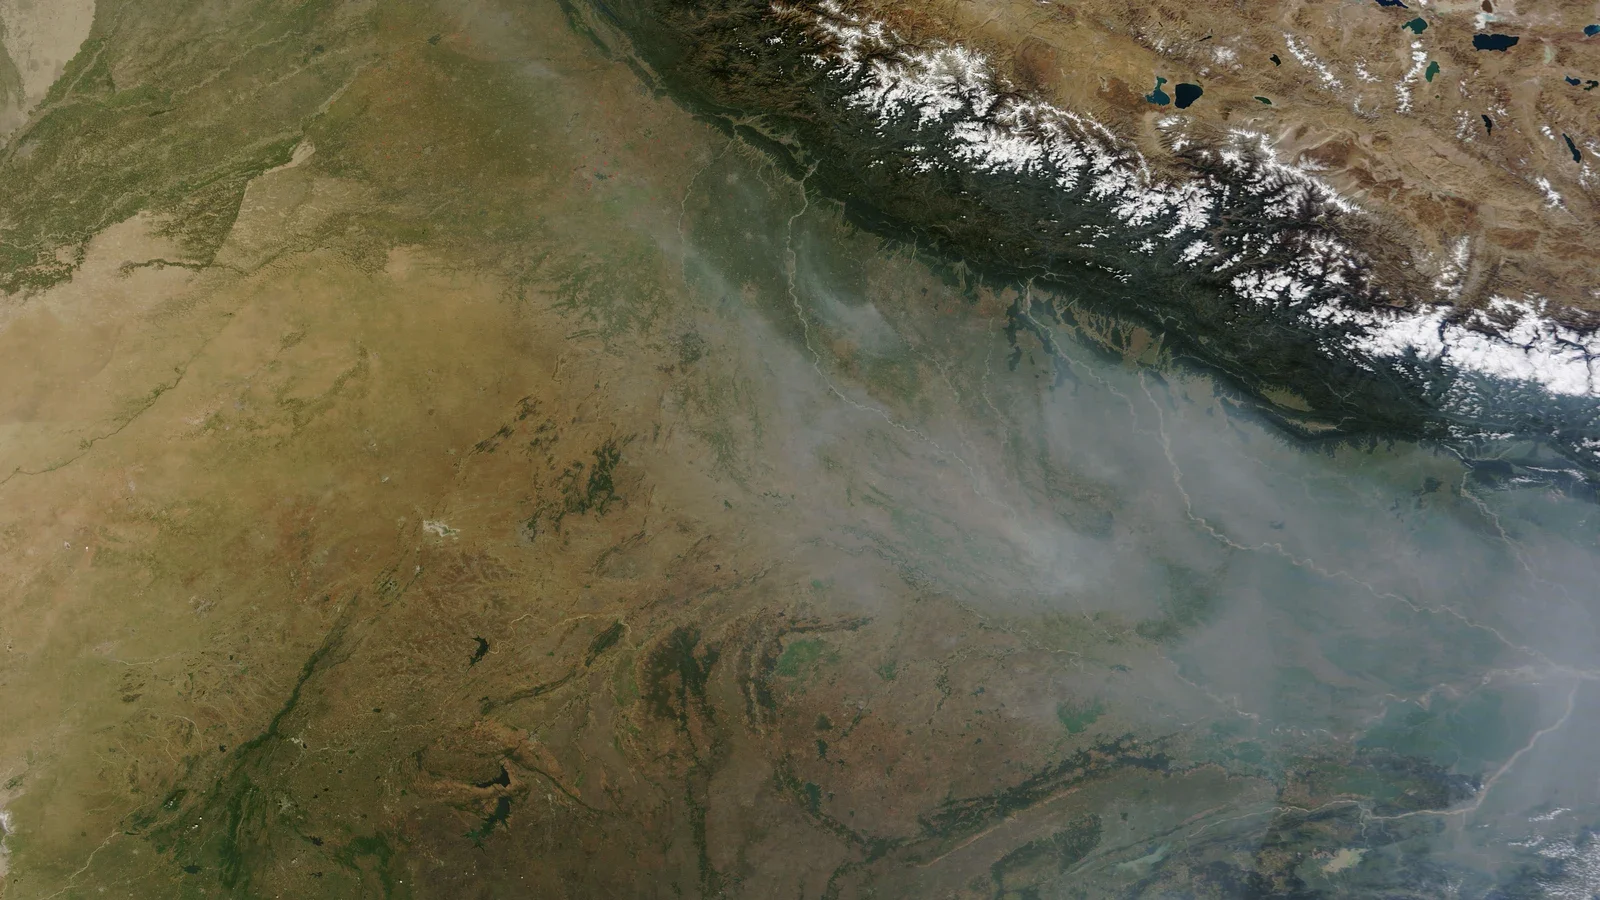
Satellite image of northwest India, 17 October 2016, from the MODIS instrument on NASA's Terra satellite; cropped. NASA's description of the original attributes the thick smoke south of the Himalaya largely to crop-residue fires in Punjab. Credit: Jeff Schmaltz, MODIS Land Rapid Response Team, NASA GSFC (public domain).
What is the pollution made of?
No single source explains the season. The Centre for Science and Environment (CSE), using the decision support system run by the Indian Institute of Tropical Meteorology (IITM), put the local share of Delhi's PM2.5 at 35% for 1 to 15 December 2025. The other 65% came from NCR districts and areas beyond. Within the local 35%, transport was the largest source:
| Local source, 1–15 Dec 2025 | Share of local PM2.5 |
|---|---|
| Transport | 46% |
| Industry | 22% |
| Households | 11% |
Source: CSE, 31 December 2025, using the IITM decision support system. The remaining local share is not shown.
Some PM2.5 is not emitted as particles at all. In CSE's breakdown for 1 to 16 November 2025, 61% of PM2.5 was secondary, formed in the air from gases that vehicles, industry and fires release, and 39% was primary, released directly as particles. Vehicles contributed about 40% of the primary part. Apportionment figures differ by method, year and time window, so they describe a period rather than a fixed split.
Where do farm fires fit?
Fires are a short, sharp contributor. After the paddy harvest, some farmers burn the leftover stubble to clear fields quickly, and most of that burning falls between mid-October and mid-November, the window CEEW uses for the stubble-burning phase. CSE found that fires supplied 4.2% of Delhi's PM2.5 on average between 1 October and 30 November 2025, with a peak above 22% in mid-November. The Centre for Research on Energy and Clean Air (CREA), as reported by the Economic Times, put the average stubble contribution at 7% in November 2025, against 20% in November 2024. The two analyses use different methods, so the numbers are not directly comparable, but both show that the share changes with the year and varies sharply from day to day.
Fires can supply more than 20% of PM2.5 on their worst days, but only briefly, and in 2025 the worst of the season came after they had faded.
Why was December worse than the stubble season?
CSE's 2025 figures show this. Delhi's PM2.5 averaged 163 µg/m³ between 1 October and 30 November, when farm fires were active. From 1 to 28 December the average was 210 µg/m³, 29% higher, while farm fires supplied 0.2% of PM2.5. CSE counted three days of "severe" air on the air quality index (AQI) in October and November, with a peak of 428 on 11 November, and five in December, with a peak of 461 on 14 December.
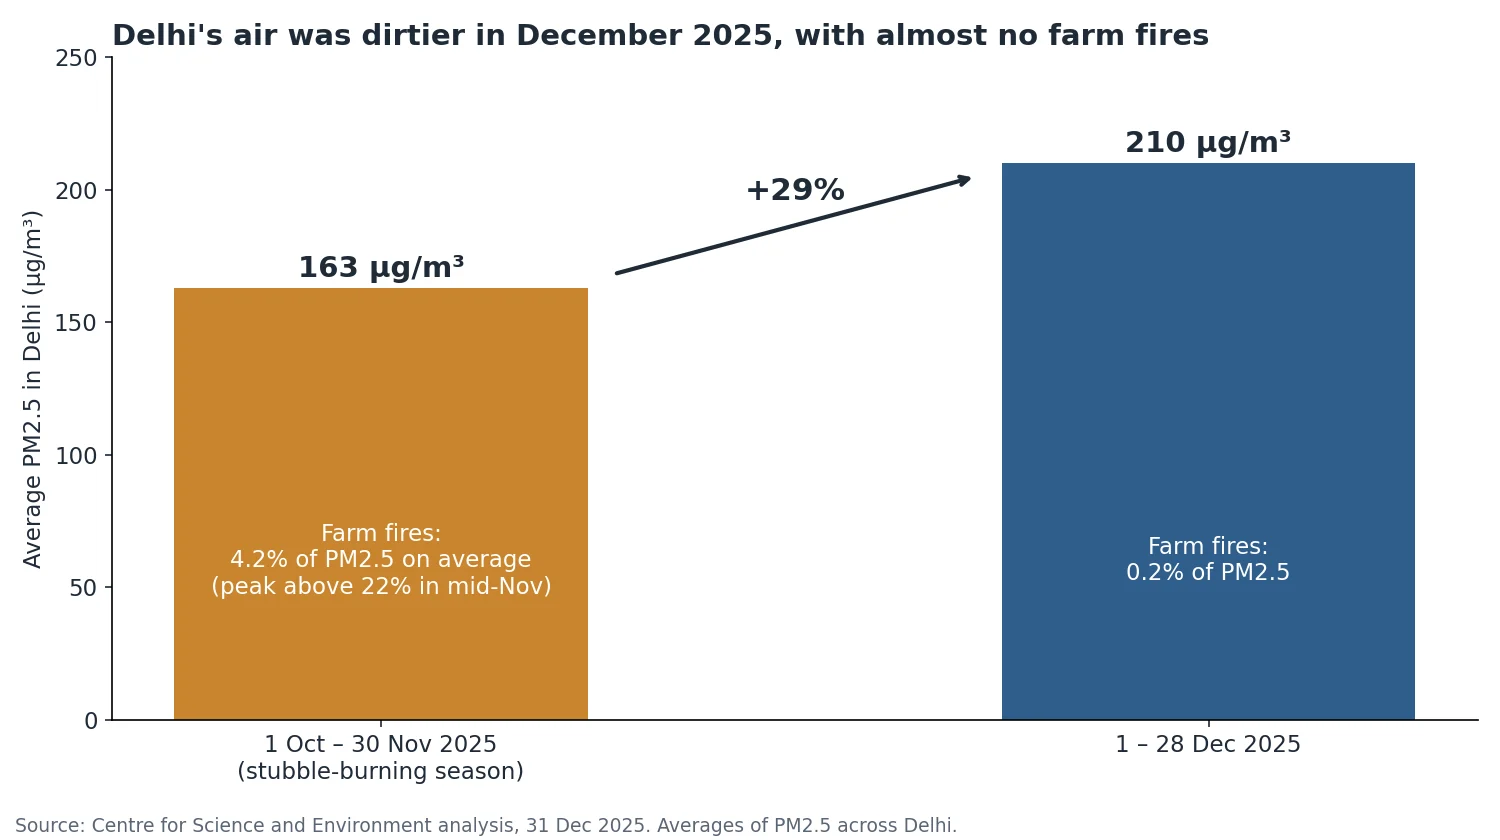
Chart by BharatQuests from CSE's 31 December 2025 analysis. Average PM2.5 across Delhi; farm-fire shares as estimated by CSE.
This is the clearest sign that fires are not the whole story. By December the fires are mostly over, yet the weather and the year-round local sources remain.
What does this mean for people?
Delhi's PM2.5 average for calendar 2025 was 97 µg/m³ by CSE's count, against India's annual standard of 40. The October–November and December averages of 163 and 210 are far above that, so the year's worst exposure is concentrated in winter. An annual average can hide that pattern, which is why the National Clean Air Programme (NCAP) progress numbers say little about how a particular winter day will feel.
Responses are split the same way as the causes. Local sources fall under rules Delhi and CAQM can enforce directly: CAQM's enforcement task force, meeting on 16 October 2026, reported 124 inspections and 55 violations at construction sites, industrial units and diesel generator sets between 25 September and 9 October. Regional sources, such as stubble burning, need action across state lines, as CAQM's reviews in Punjab districts show. When readings worsen, Delhi-NCR's authorities can also apply the Graded Response Action Plan (GRAP), a ladder of progressively stricter emergency measures.
How should you read the daily numbers?
Check which measure you are looking at. A private tracker's AQI, a US-scale reading and the official AQI from the Central Pollution Control Board can differ on the same day. A city-wide figure can also differ from the air on your street, and a forecast is only an estimate until measured readings arrive.
Whatever the headline cause on a given day, the pattern repeats because both halves of the mechanism return each winter. Emissions set the baseline, and the cold, still air decides how much of it stays.